Twelve Years of Bioinformatics Jobs in Germany: A Data-Driven Look at the Market
Insights from bioinformatics job postings in the DACH region
It is now 25 years since I decided to enter the field of bioinformatics, and thanks to my work in both academic research and industry, I feel I have gained a decent understanding of the related job market. Occasionally, my views are challenged by surprising claims. I therefore always wanted to support some hypothesis that I had about the job market with actual data. Questions like: how many positions are offered per year in industry vs. academia? Which companies offer the most bioinformatics positions? And in which regions are most jobs offered? Since bioinformatics is a small field, no such analysis is available to the best of my knowledge. Time to change that!
The data source that I can use for this evaluation is a collection of bioinformatics job newsletters from 2013 to today. So, about 12 years of emails. Like most people doing data science, I anticipated that the resulting data would be messy: tricky to extract, cumbersome to normalize, and annoying to clean up. As a result, I wasn’t really inclined to do it. Now, I figured that the improved capabilities of LLMs could help me reduce those efforts significantly, especially given that it is acceptable for me that the cleaned data is not 100% correct in all cases. Also, it is quick and easy to check if the extracted data is plausible.
Data Source
The job newsletters I intend to analyze come from jobvector, which is the largest job exchange covering STEM fields in German-speaking regions. The featured jobs are mostly located in either Germany, Austria, Switzerland, or Luxembourg. However, I do not know how representative the data is for countries other than Germany, so I focus on that. There are, of course, many other very interesting job markets for bioinformaticians, but this is the data source I have. For Germany, this is probably the best single data source one can get.
In 2013, I created a profile on jobvector, selecting my interest in bioinformatics, and subscribed to the JobMail email update service. For this analysis, I exported all those emails into an .mbox file, from which I extracted all email dates and message bodies. The message bodies came in both HTML and text formats, and I extracted only the text format. The outcome is a big file containing a total of 598 emails.
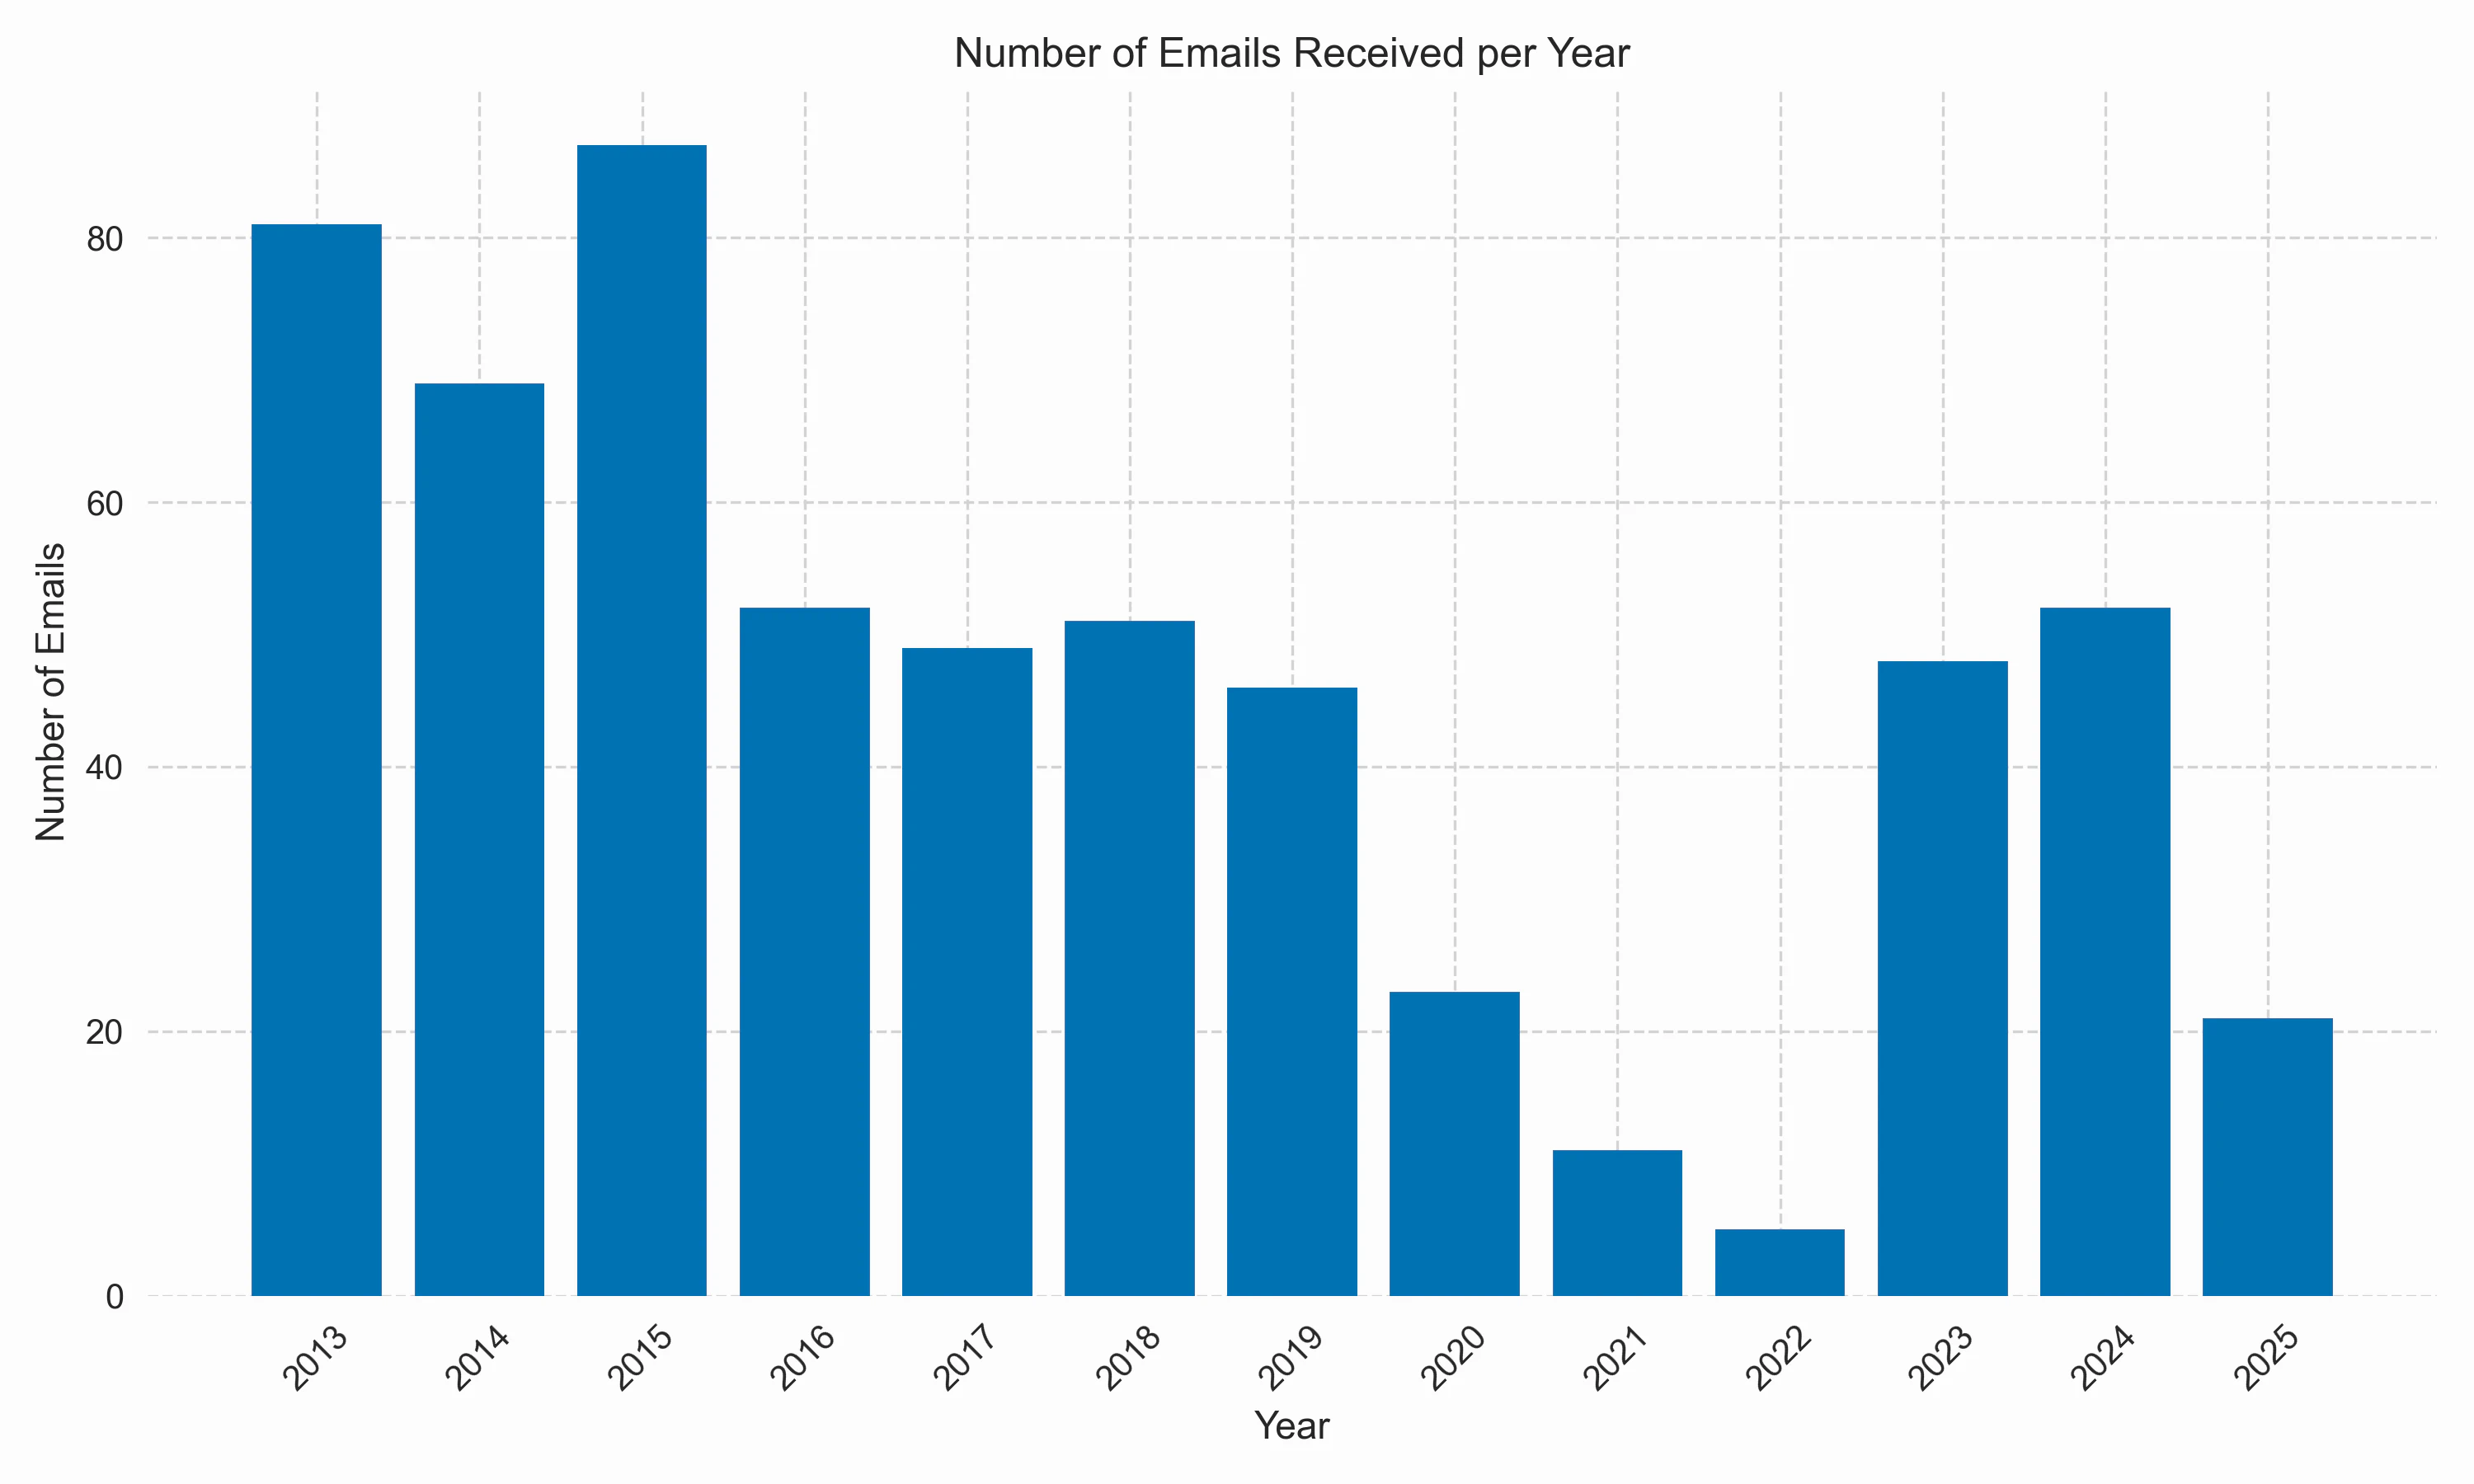
As you can see, the JobMail is not strictly a weekly newsletter. The website says that I never miss jobs via JobMail and that they are sent once new positions are published. It looks as if they limited the email frequency to weekly in 2015; from that point on, I received no more than 52 emails per year.
Extraction of jobs
The next step is the extraction of individual job postings from the emails. The email body text contains not only the job listings themselves but also a mixed bag of other things like introductory text, imprints, or links to events, other services, and newsletter management. I prompted GPT-5 with fragments of those texts and tasked it with extracting only the actual job positions for me. It came up with a Python script that essentially cleans up the email text (space trimming, empty line removal, …), removes all irrelevant text by building a “negative set” of keywords (“unsubscribe,” “copyright,”…) and then tries to parse the positions using regular expressions. However, even when working on a small subset of emails, it couldn’t get it right after several iterations. I then noted some structural properties in the email text; for example, the job’s location always appeared after a bullet symbol. I nudged GPT-5 to use those markers, made some manual adjustments, and finally managed to get a script that works on a large fraction of emails, specifically for emails after February 2018.
It does not surprise me that, over the course of those 12 years, there were several small and big changes to the email format. Regarding data extraction, especially that February 2018 change was impactful. Another big change occurred in May 2025, and so I decided early not to include them at all.
Unfortunately, I was unable to come up with an extraction script that worked reliably for all emails before February 2018. So I tried a different approach: prompting an LLM to be a data extractor. I would loop over all the emails and make use of the structured output feature (via the llm CLI tool) to extract only the jobs from the body text. Interestingly, this was not reliable when using cloud-based models (“system overload”). So instead of making the script fault-tolerant, I decided to install an LLM locally, specifically the gpt-oss:20b model run via ollama on my MacBook Pro. It actually worked quite nicely. Slow, of course, but after a runtime of 9h, it had worked through 345 emails, extracting over 4200 positions that I could inspect the next morning.
Combining this with the output from the other script, I now had about 8500 job postings over 12 years at my disposal. Each posting would be a triple of [Position, Organisation, City] together with the email date. Here is a typical posting:
2018-09-04,"Bioinformatiker - Softwareentwicklung, Software für Impfstoffproduktion (m/w)",BioNTech AG,Mainz
Data cleaning and normalization
Next, we must bring the data into a form that allows for its analysis and visualization. This newsletter is intended for job seekers rather than data analysis, and it can be expected that the email content and format change over such a long time. Therefore, I expected the extracted data to be messy - and I was not disappointed in this regard.
Some of the things that I would see:
- Occasional switches between position and organization
- Some months when all information is given in ALL CAPS
- Typos in any field
- Various inconsistencies in cities (“Biberach” vs. “Biberach / Baden” vs. “Biberach an der Riß”), organizations (“justus liebig university” vs. “justus liebig universität gießen” vs. “justus-liebig-universität giessen”), and of course job titles
There was no way that I would thoroughly clean up all of this. Strongly leaning on the Pareto principle, I went with the following approach:
- No manual correction of the full table
- Another correction within the extraction scripts to repair the vast majority of the position switches
- Extraction of the lowercase cities and organization names into separate (much smaller) files that I could automatically or manually add normalized names to and enrich with other data such as country names
In some cases the same job posting appeared again in subsequent emails. Since I prefer not to double-count these entries, I created another cleanup script that removed 598 postings that had already appeared in previous emails, leaving a total of 7,893 new postings.
High-level trends over time
Let us begin the analysis with a high-level view regarding the frequency of job postings over time. On average, there have been about 600 new bioinformatics positions posted per year. At first sight, this seems like a large number, but keep in mind that this includes PhD positions, student trainees, and also some jobs that would match biologists or general IT staff as well. So, the actual number of true bioinformatics jobs is significantly smaller.
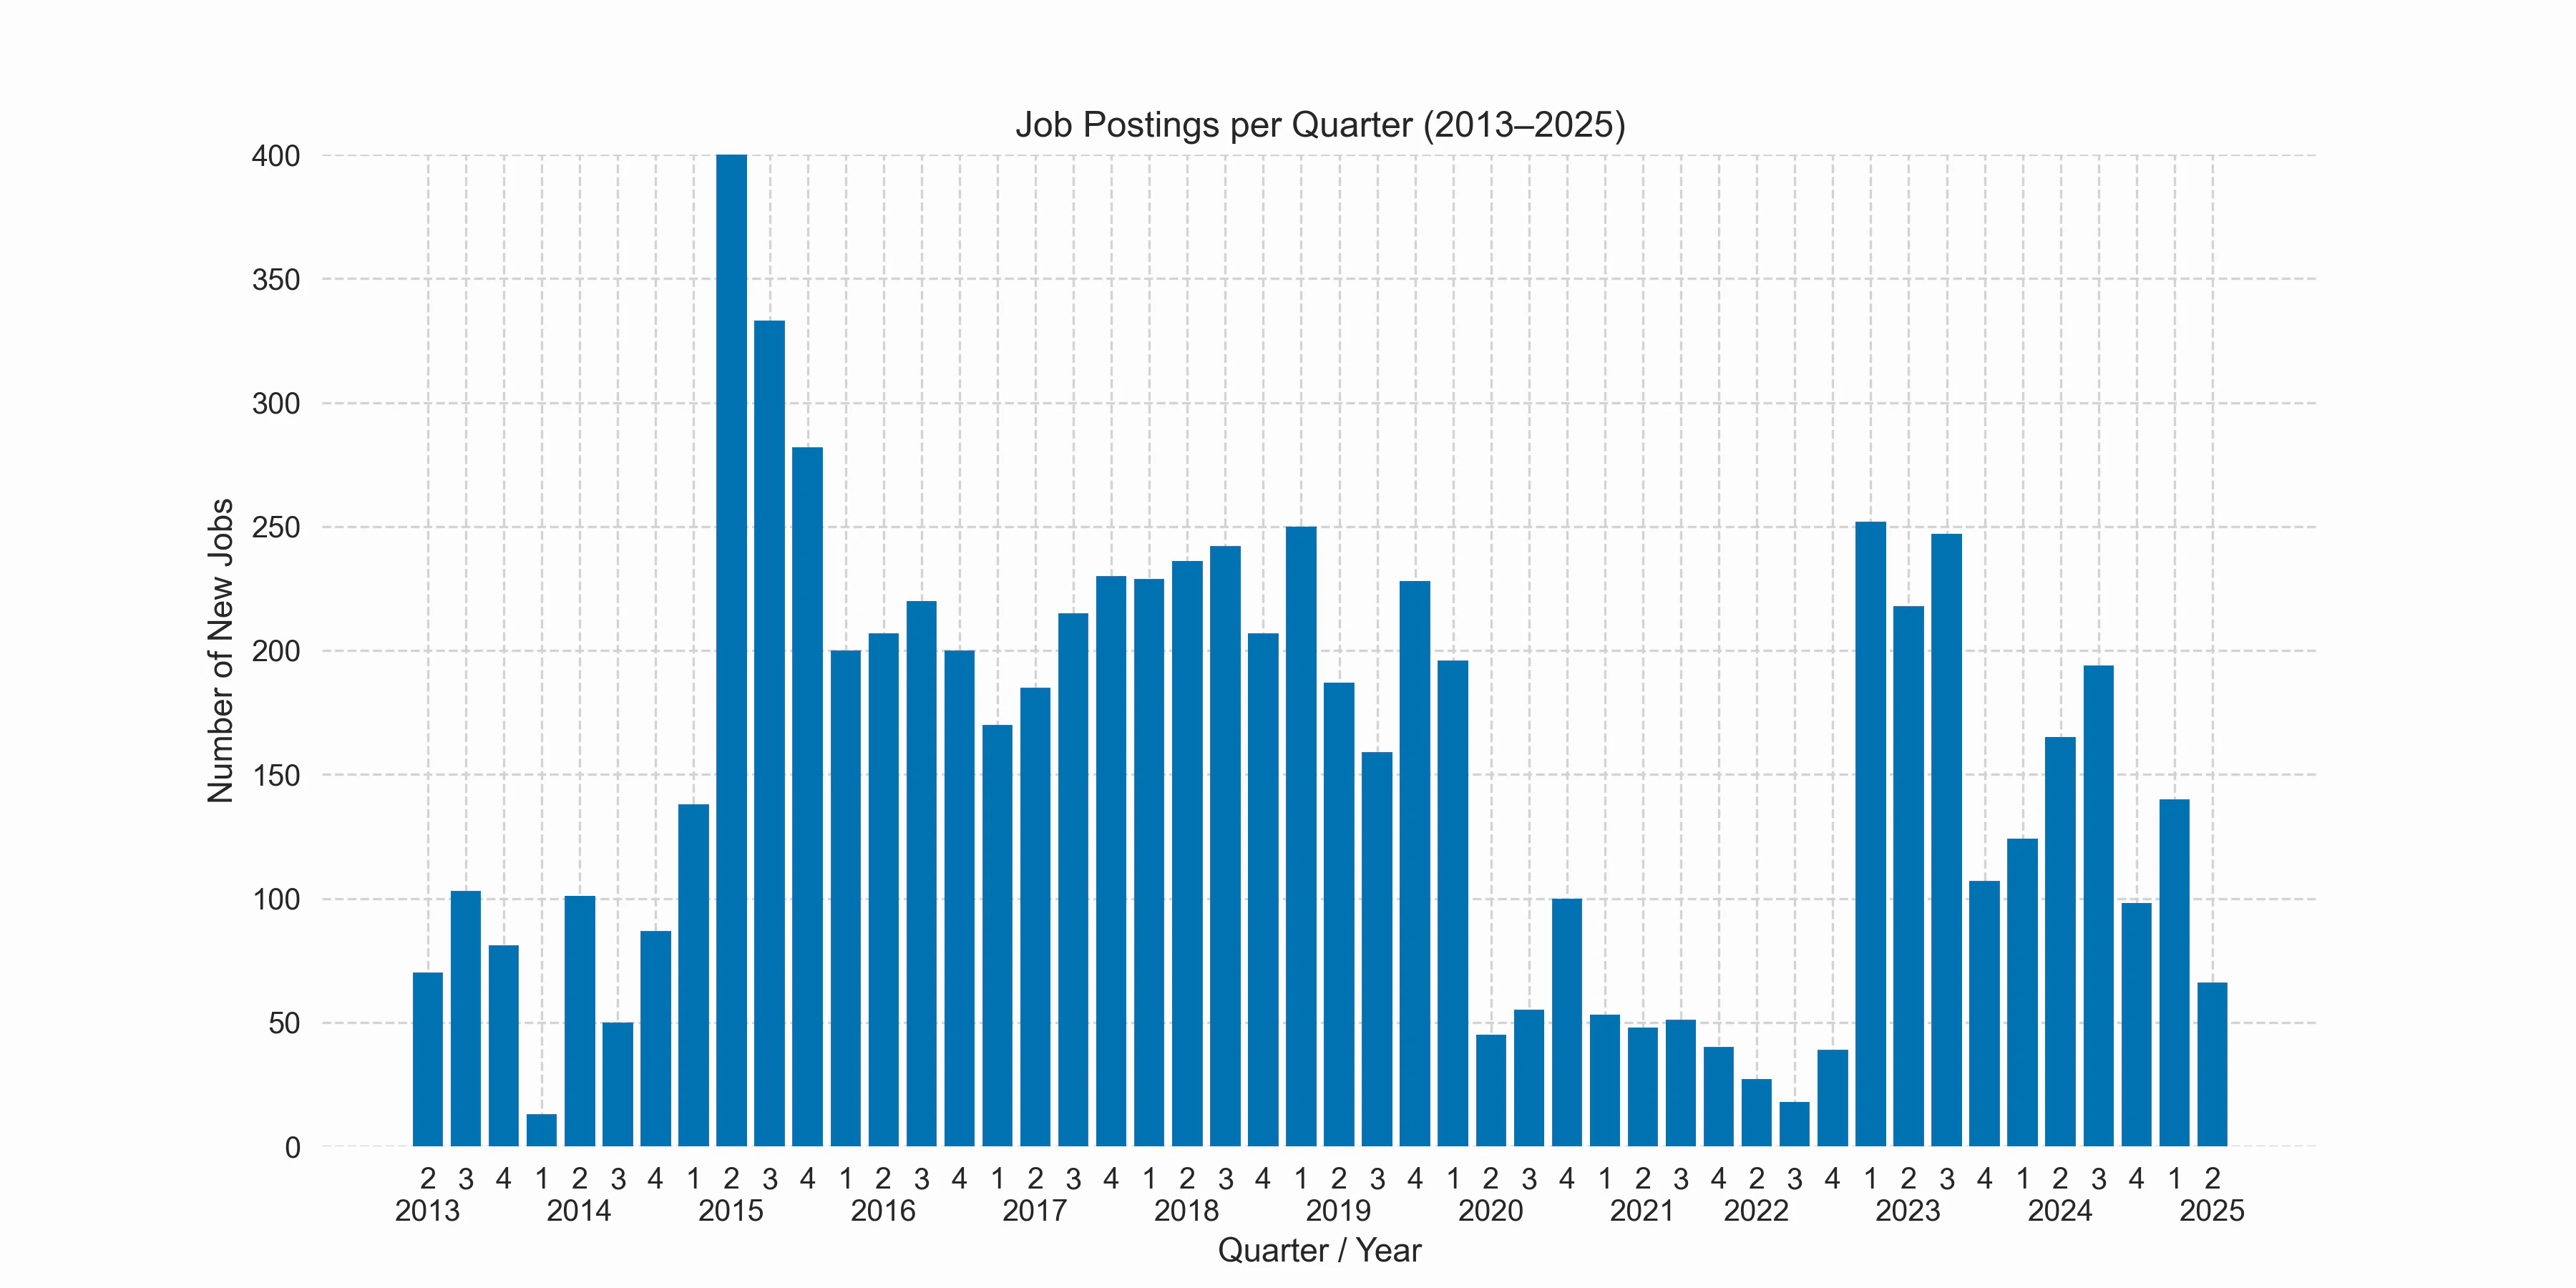
The above plot shows the number of postings per quarter. There is an obvious outlier in 2015-Q2, which I attribute to a temporary change in jobvector, where the job filter has been interpreted too broadly, including many positions better suited to biologists (e.g., wet-lab work) or engineers/technicians without an actual need for bioinformatics knowledge. There also seems to be a slight seasonal trend, with most jobs usually posted in Q3.
Clearly visible is a COVID-19 job gap, spanning the time between 2020-Q2 and 2022-Q4. However, this pandemic bump is not necessarily obvious because the emergency funding in virus research that took place in Germany could have trickled down to bioinformatics positions. But looking at the actual postings from that period, only a few institutions actually created new positions for that research. BioNTech itself was on a hiring spree before that, with 136 (!) bioinformatics jobs posted between 2018 and 2019. Interestingly, the number of positions jumped to pre-pandemic numbers in 2023-Q1, whereas starting in 2023-Q4 the number of postings went to lower levels. In fact, this looks like a downward trend in bioinformatics jobs starting in 2023.
Regional distribution and hot-spots
Let us now take a look at how the jobs are geographically distributed. To that end, I took the list of 627 city names extracted from the list of job positions. This list was again filled with messy data. Instead of the single city of Köln (Cologne) I would see: “cologne”,”cologne / düsseldorf area”, ““cologne, germany”, “köln lindenthal”, and so on. This time, I again used my local gpt-oss:20b model to clean up and normalize this for me. Basically, it added a clear city name if possible, and otherwise left it empty. That resulted in 310 different city names. Next, I tasked an LLM with the creation of a script that would geocode my city list and visualize it on a map.
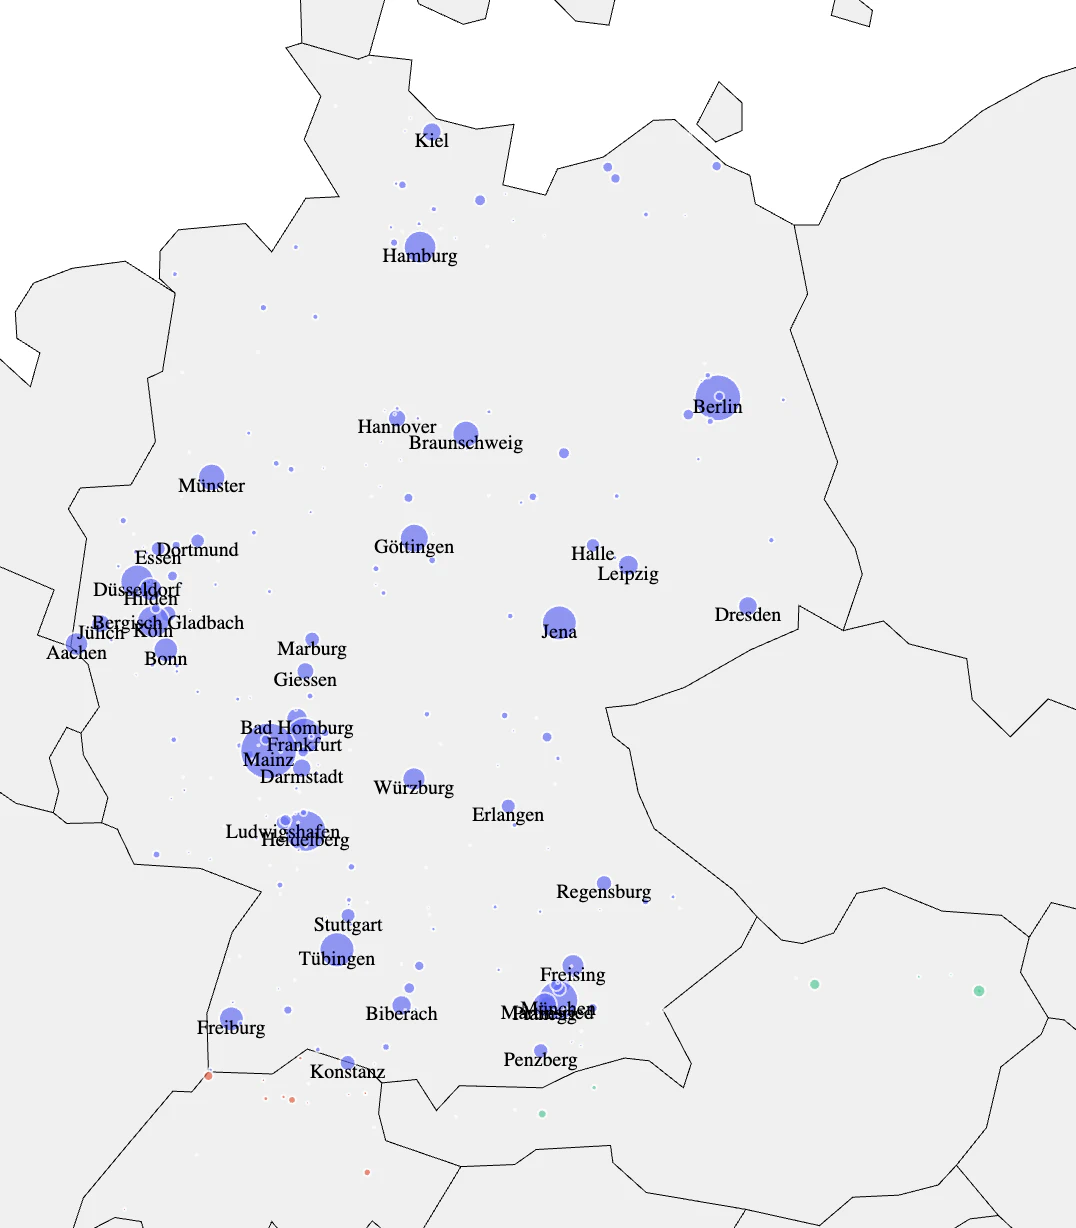
This bubble map is not beautiful but actually quite interesting. Cities with more than 40 jobs received a label with their name - sorry for the still existing readability issues from some nearby cities. For a scale, the bubble size of Berlin represents 464 jobs and that of Dresden below 83. We directly see that, while jobs in Switzerland and Austria are included, the number of posted jobs is smaller than I would expect, for example, for Vienna (35) and Basel (21). So, I believe that the Jobvector data unfortunately is not representative of these regions. In Germany, I directly note big bubbles at many well-known university towns.
Several important clusters are clearly visible. Starting from the bottom, we see the strong Munich area that includes cities like Freising, Planegg, Martinsried, and Penzberg. Besides some well-known academic institutions, the area has locations of companies like Roche (Penzberg), Medigene, and Evotec (both Planegg). A bit further east, there is Biberach, which appears on the map due to the pharma company Boehringer Ingelheim. Tübingen, Heidelberg, and Freiburg are relatively small cities, but all have very well-known universities, which are now surrounded by strong life-science industries. Then we have the big cluster in and around Mainz and Frankfurt (more on that below). In case you are wondering, Merck is located in Darmstadt and Fresenius Medical Care in Bad Homburg. And of course, the Rhineland region with cities like Cologne, Düsseldorf, and Dortmund, where well-known companies like Bayer, Qiagen, and Miltenyi Biotec are located.
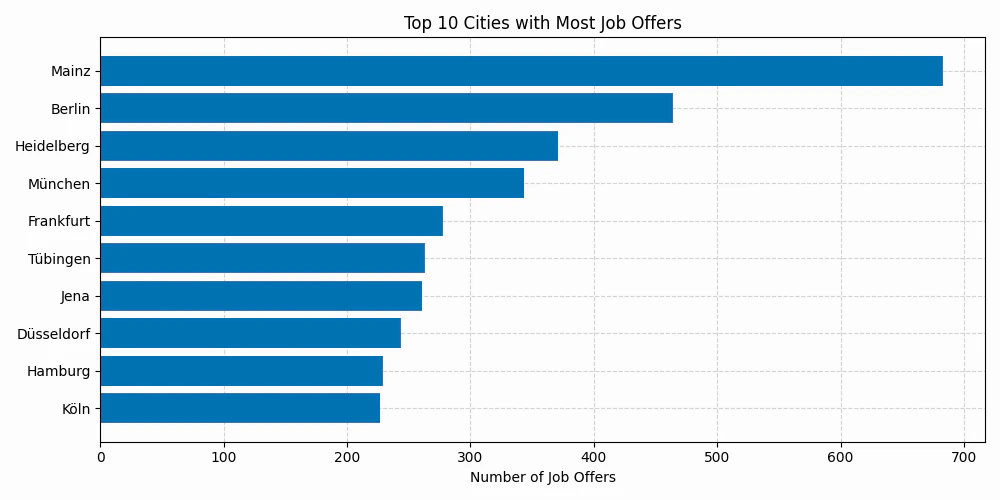
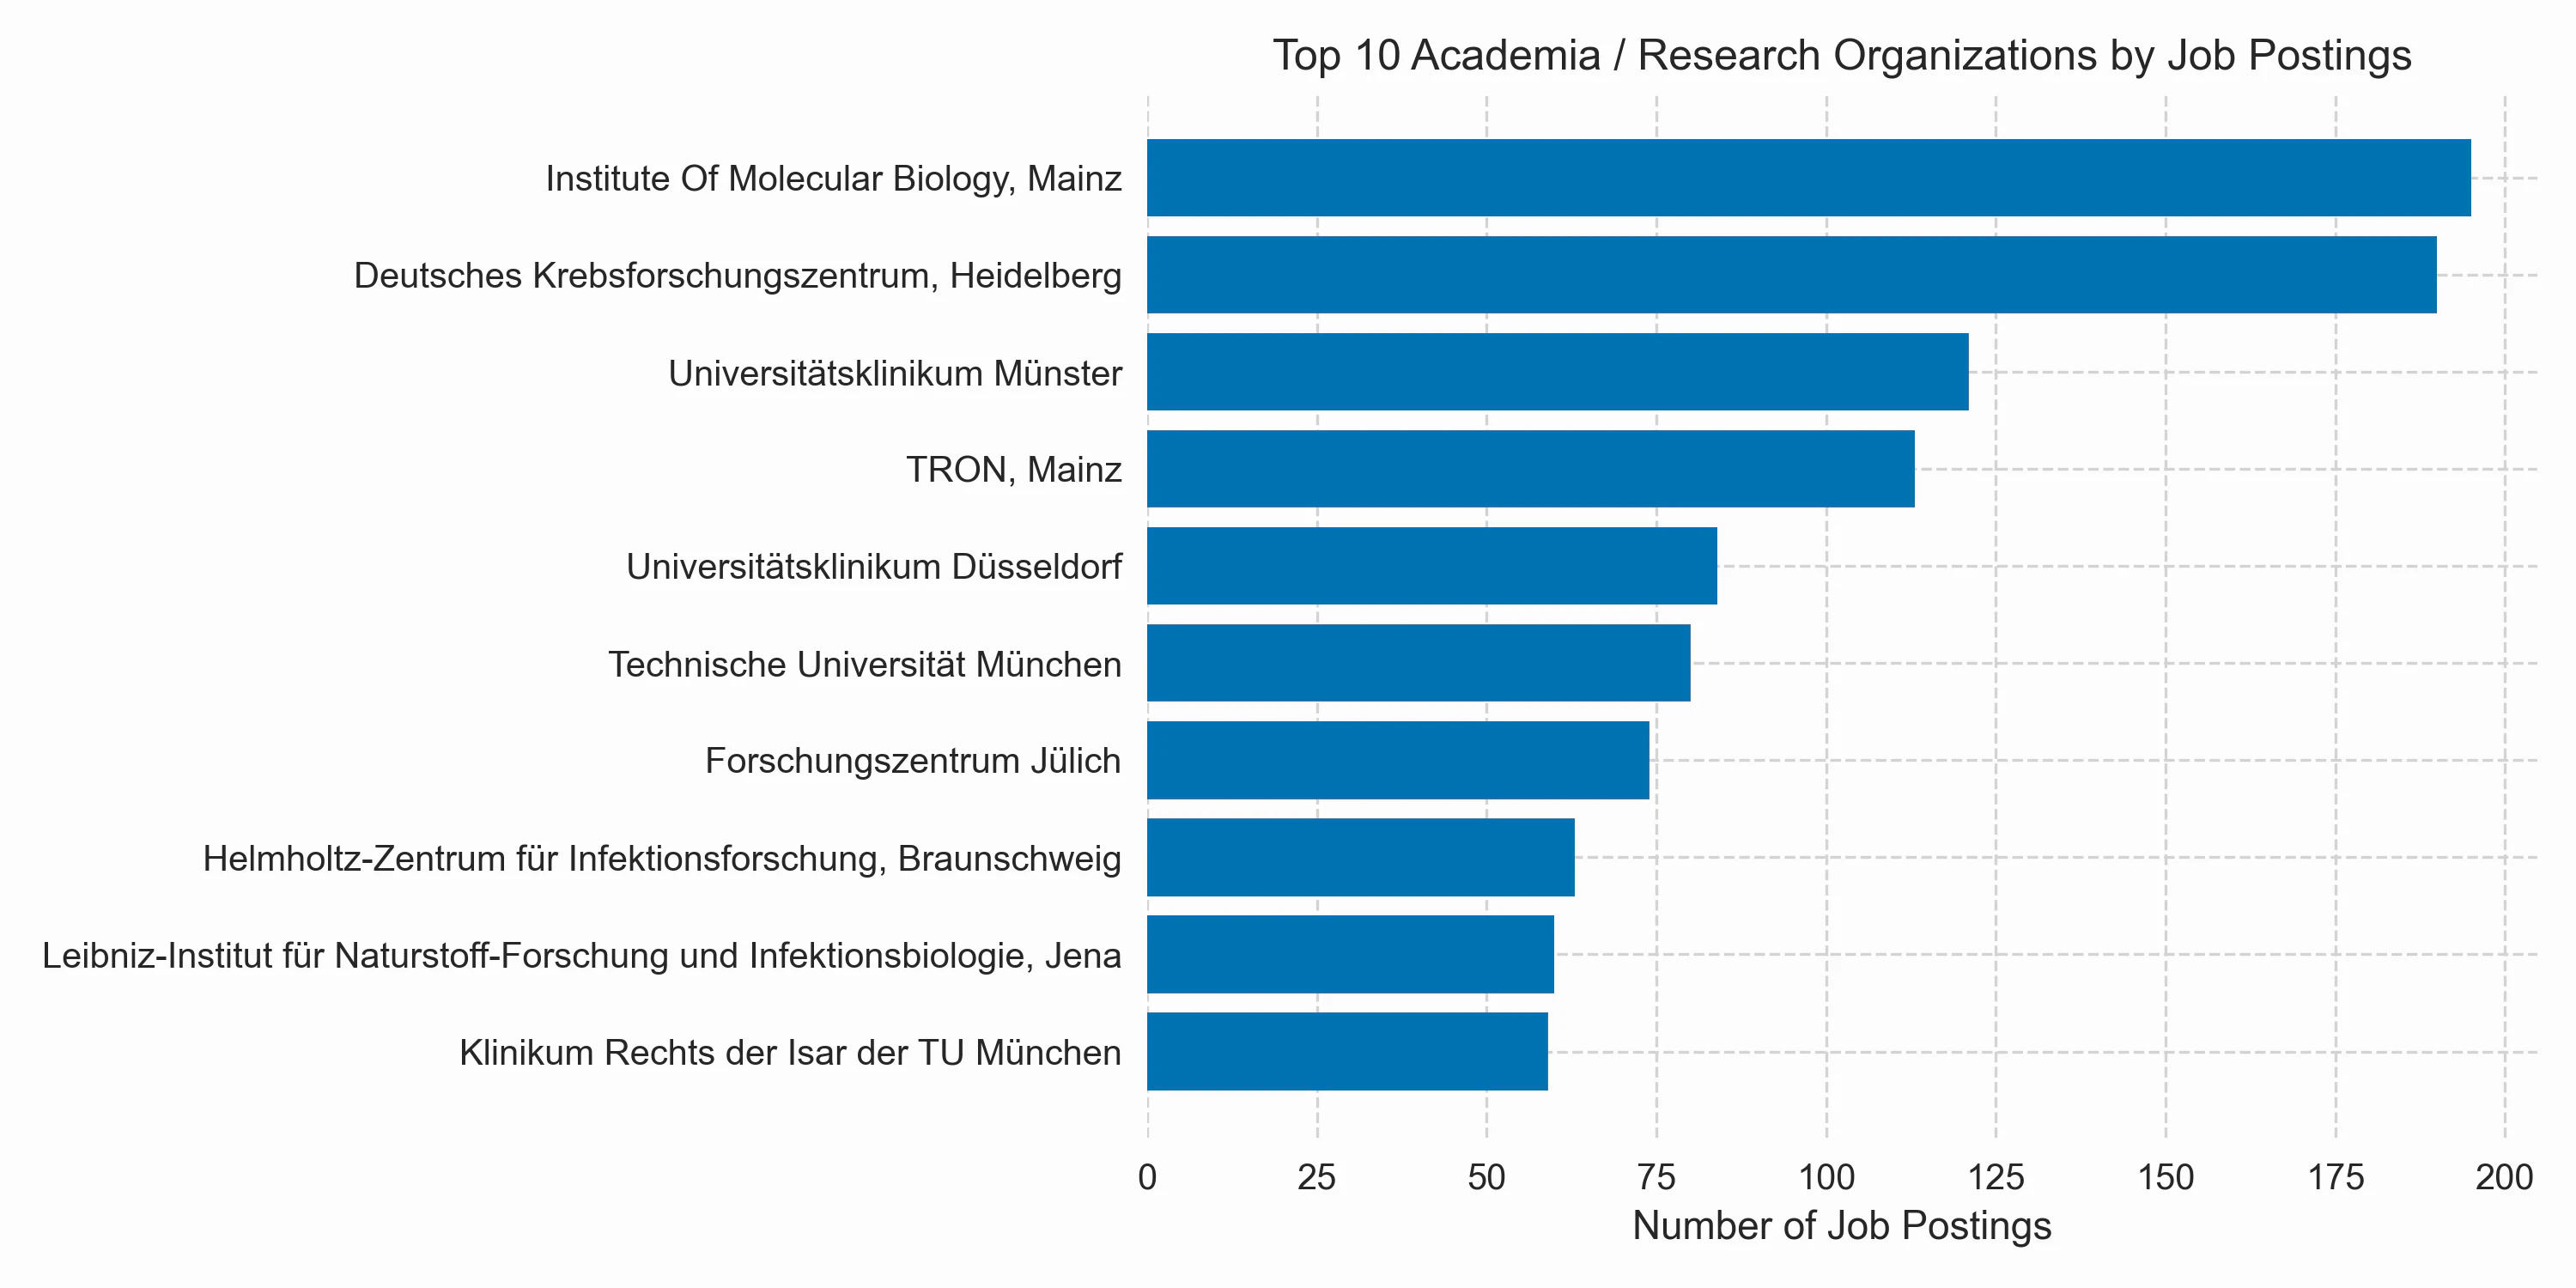
Looking at the top cities, we see the pole position occupied by a city most people outside Germany probably wouldn’t have guessed: Mainz. It’s a city of about 220,000 inhabitants, close to Frankfurt/Main. But it has several big research institutes and is home to the now world-famous biotech company BioNTech. The three organizations that have been offering the most positions in Mainz are BioNTech (291), the Institute of Molecular Biology (193), and TRON (113).
Berlin comes in second, which is mainly driven by the presence of large government agencies like the German Federal Institute for Risk Assessment (83), the BAM (material sciences, 22 jobs), the Robert Koch Institute (disease control and prevention, 6 jobs), and others. It also has a number of large research institutions like the Max Delbrück Center for Molecular Medicine (50) and the Max-Planck Institute for Molecular Genetics (17), and it is home to big hospitals like the Charité (42), all of which need bioinformaticians for their data analysis. Berlin also hosts several life science companies, but the number of job positions is small compared to the above organizations.
The third place is taken by Heidelberg, which is another small city (150,000) but well-known for its university and clinic. While research institutes like the DKFZ (138), University Hospital (42), and EMBL (19) are offering most positions, there is also a sprawling biotech ecosystem with companies like Molecular Health (44) and BioMed X (32).
Employers and organization types
The above examples already paint a rough picture of what types of organizations typically employ bioinformaticians in Germany. However, we would like to have a more detailed picture of the types of employers. In order to tackle questions like how many postings are offered in industry vs. academia, we need to classify the organizations into suitable buckets. Let’s begin by defining a high-level category.
| Category | Description |
|---|---|
| Academia / Research | Universities, research institutes, and clinics |
| Industry / Private sector | For-profit companies in biotech, pharma, software, consulting, or related industries |
| Government / Public sector | Government agencies or publicly funded bodies not classified as academic |
| Other / Non-profit / International | Non-profit foundations, NGOs, international organisations, or unknown/unclear entries |
To be able to discern these a little better, I went on to define slightly more detailed categories:
| Category | Description |
|---|---|
| University | Universities. Examples: FU Berlin, LMU München, TU Braunschweig |
| Research institute | Public research organisations such as Max Planck, Helmholtz, Leibniz, DKFZ, Fraunhofer, IMB Mainz, EMBL |
| Clinic / Hospital | Clinical or medical research institutions and university hospitals. Examples: Charité, UKSH, Medizinische Fakultät Mannheim |
| Biotech / Pharma | Pharmaceutical and biotech companies. Examples: Bayer AG, Evotec, Panpharma, Fresenius |
| Software / Technology | Companies providing bioinformatics, laboratory, or analytics software/hardware. Examples: PerkinElmer, a-tune Software |
| Consulting | Consulting firms working in data, IT, or analytics. Example: D-Fine, Accenture Life Sciences |
| Industrial / Engineering | Broader industrial or engineering companies. Examples: Dräger Safety, Testo, EnBW |
| Public health / Government | National or regional institutes (non-university) such as RKI, BfR, or PEI |
| Unknown | Entries where the organisation type cannot be inferred |
I extracted a list of 1,157 organizations from the job postings. This table was less messy than the cities, but it still often contained alternate names for the same organization. However, this is okay, as long as those alternate names receive the same classification, because the categories are mapped back to the full list of job postings for our analysis. The classification task itself was assigned to GPT-5, which largely did a good job. I manually corrected the category assignments here and there, fixing a dozen or so of the inconsistencies or mistakes I immediately spotted. That said, let’s do some visualization of the categorized job postings!
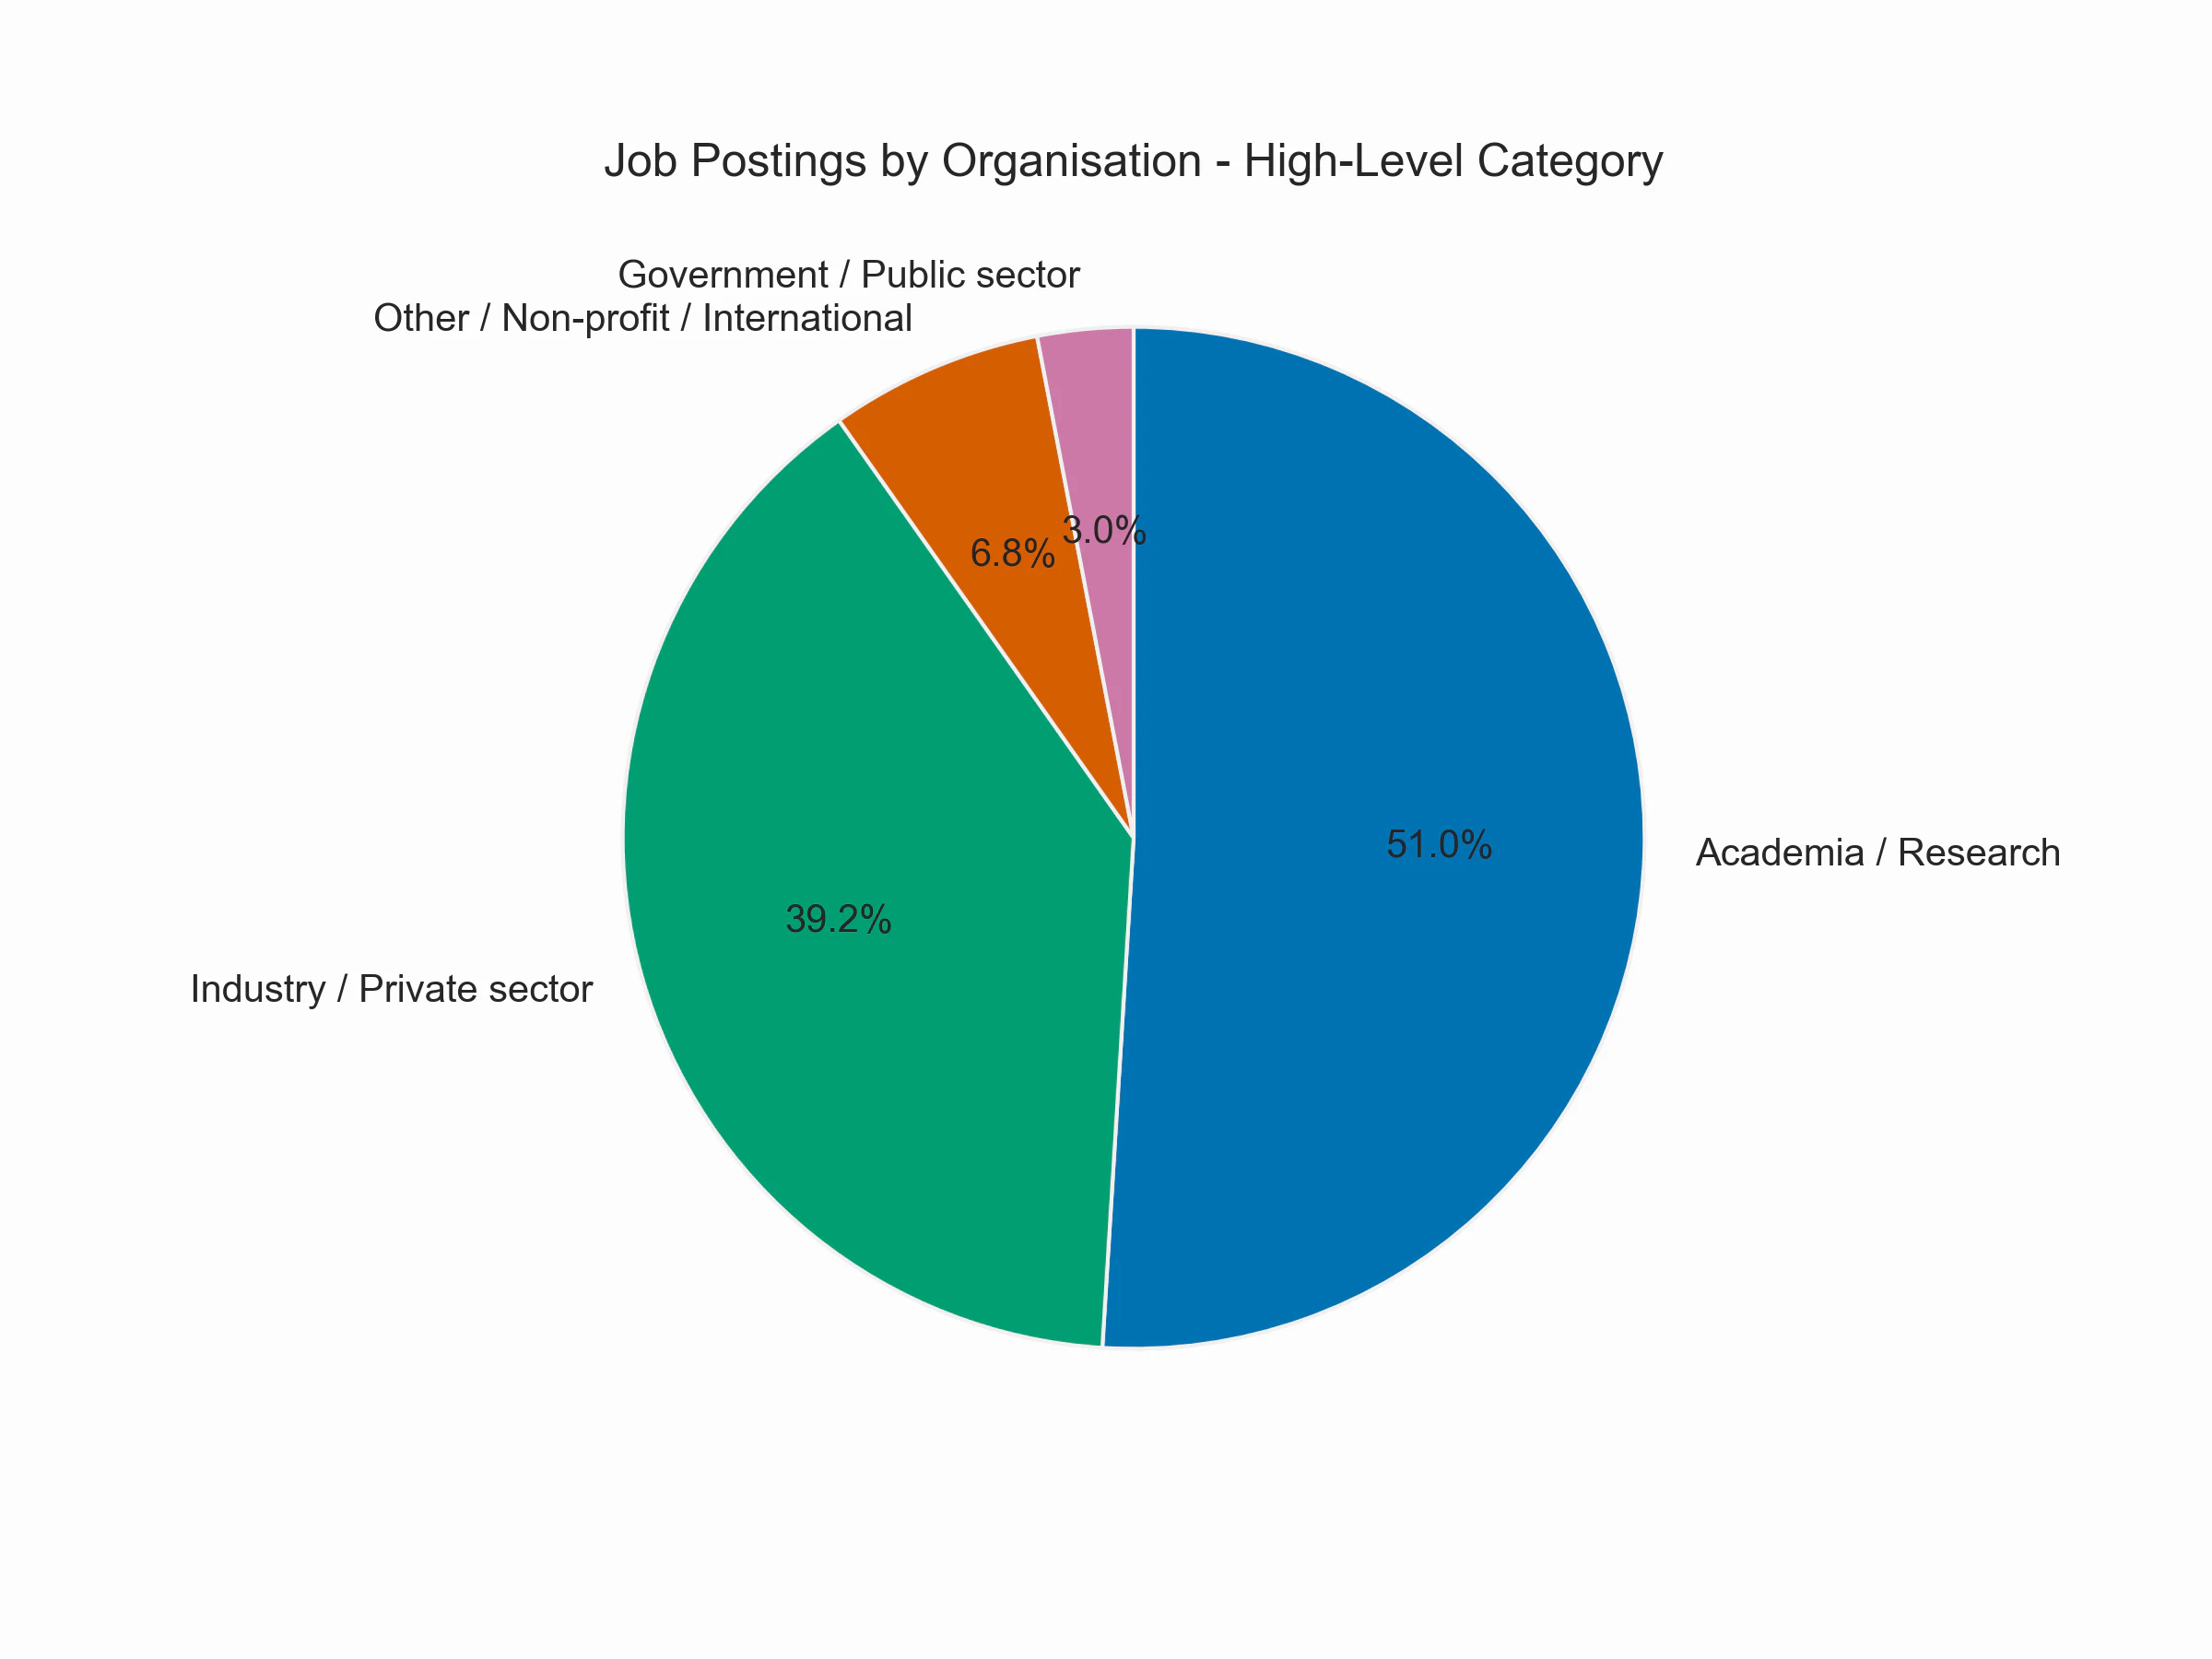
There we have it! The largest proportion of postings is from academia and research organizations rather than from industry. However, does that mean that most bioinformaticians also work in academia? Not necessarily. After university, many bioinformaticians continue to pursue a PhD, as many people believe this is mandatory for the relevant positions in both academia and the pharma/biotech industries. So, independent of whether they enter industry or stay in academia afterward with the PhD, they first have to obtain a PhD position, and those positions are also among the postings. A quick check (searching for PhD position & PhD student among job titles) reveals that at least 17% of all postings refer to PhD positions. If we subtract the PhD positions from academia, we have 51% - 17% = 34% in academia, which is actually slightly less than in industry. This still is a significant fraction, probably the largest among all IT-related fields. A 50-50 split between academia and industry seems like a good rule of thumb for bioinformatics jobs in Germany.
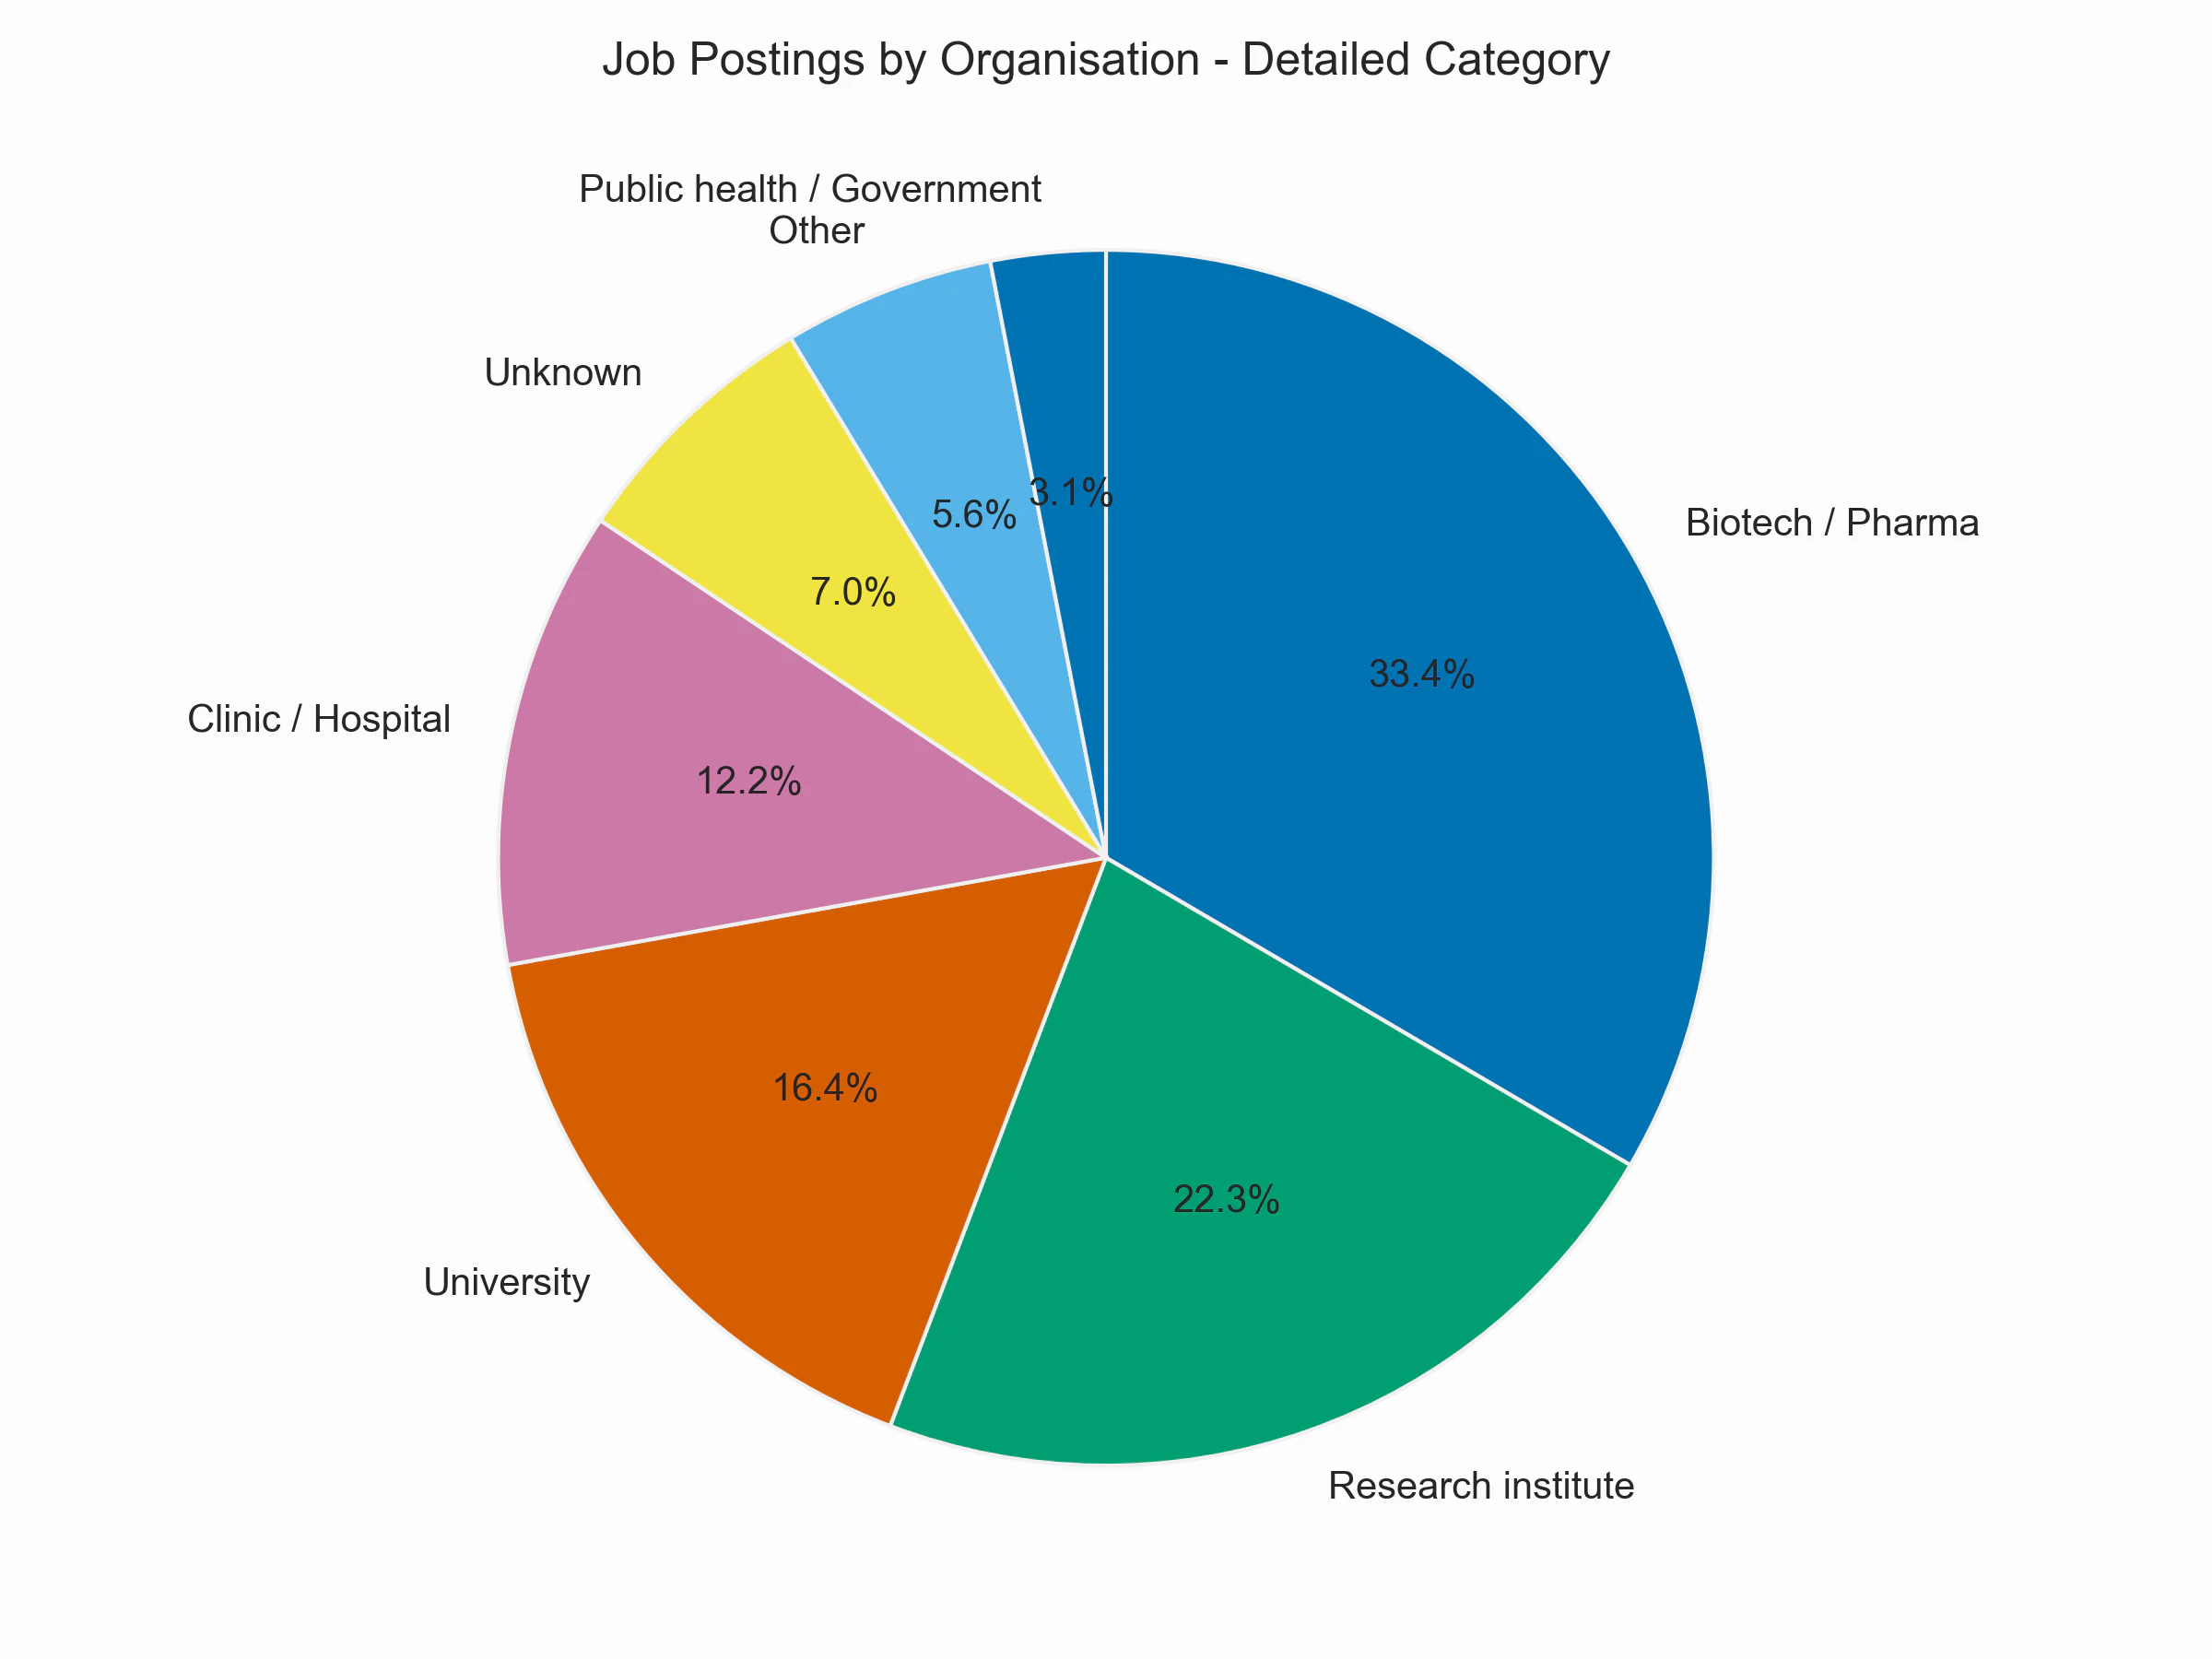
Here is the plot of the job postings by detailed organization category. The largest block is Biotech/Pharma, as these constitute the majority of industry jobs. On the academic side, this is mainly split into research institutes, universities, and clinics. The Other category sums up the detailed categories Software/Technology, Industrial/Engineering, Labs and Consulting, each of which has below 2% of all postings.
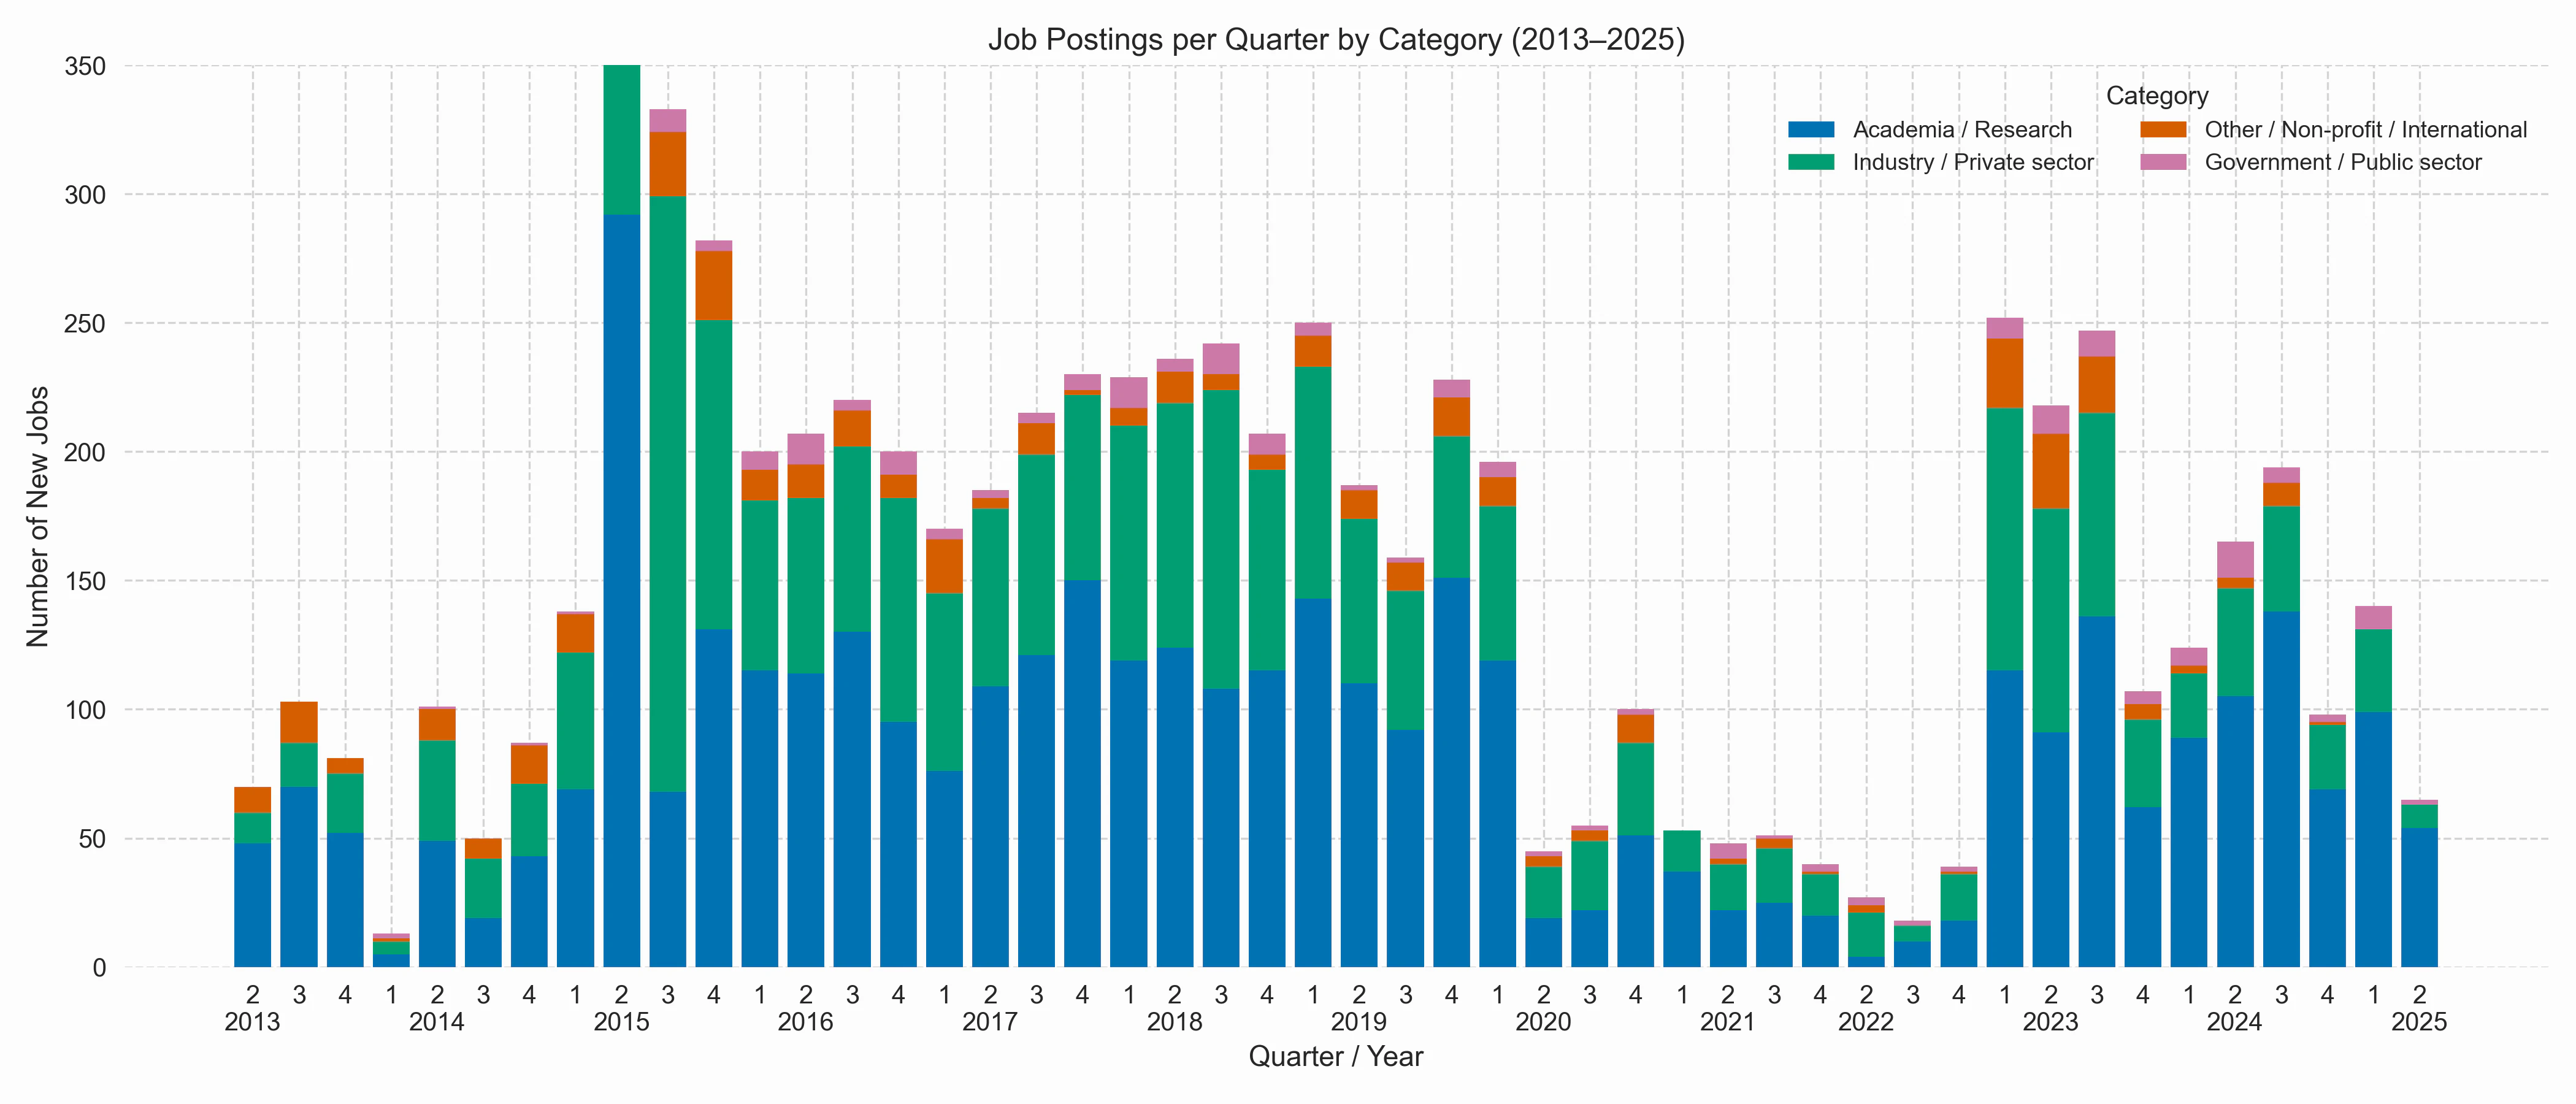
We can also again plot the number of new jobs as a time trend, but now stacked with each of the high-level categories. I find it noteworthy that job postings from Academia are relatively constant after the COVID-19 gap, whereas industry jobs are actually declining. Note that 2015-Q2 is again capped by 350, as this month was an outlier due to the temporary inclusion of related job profiles.
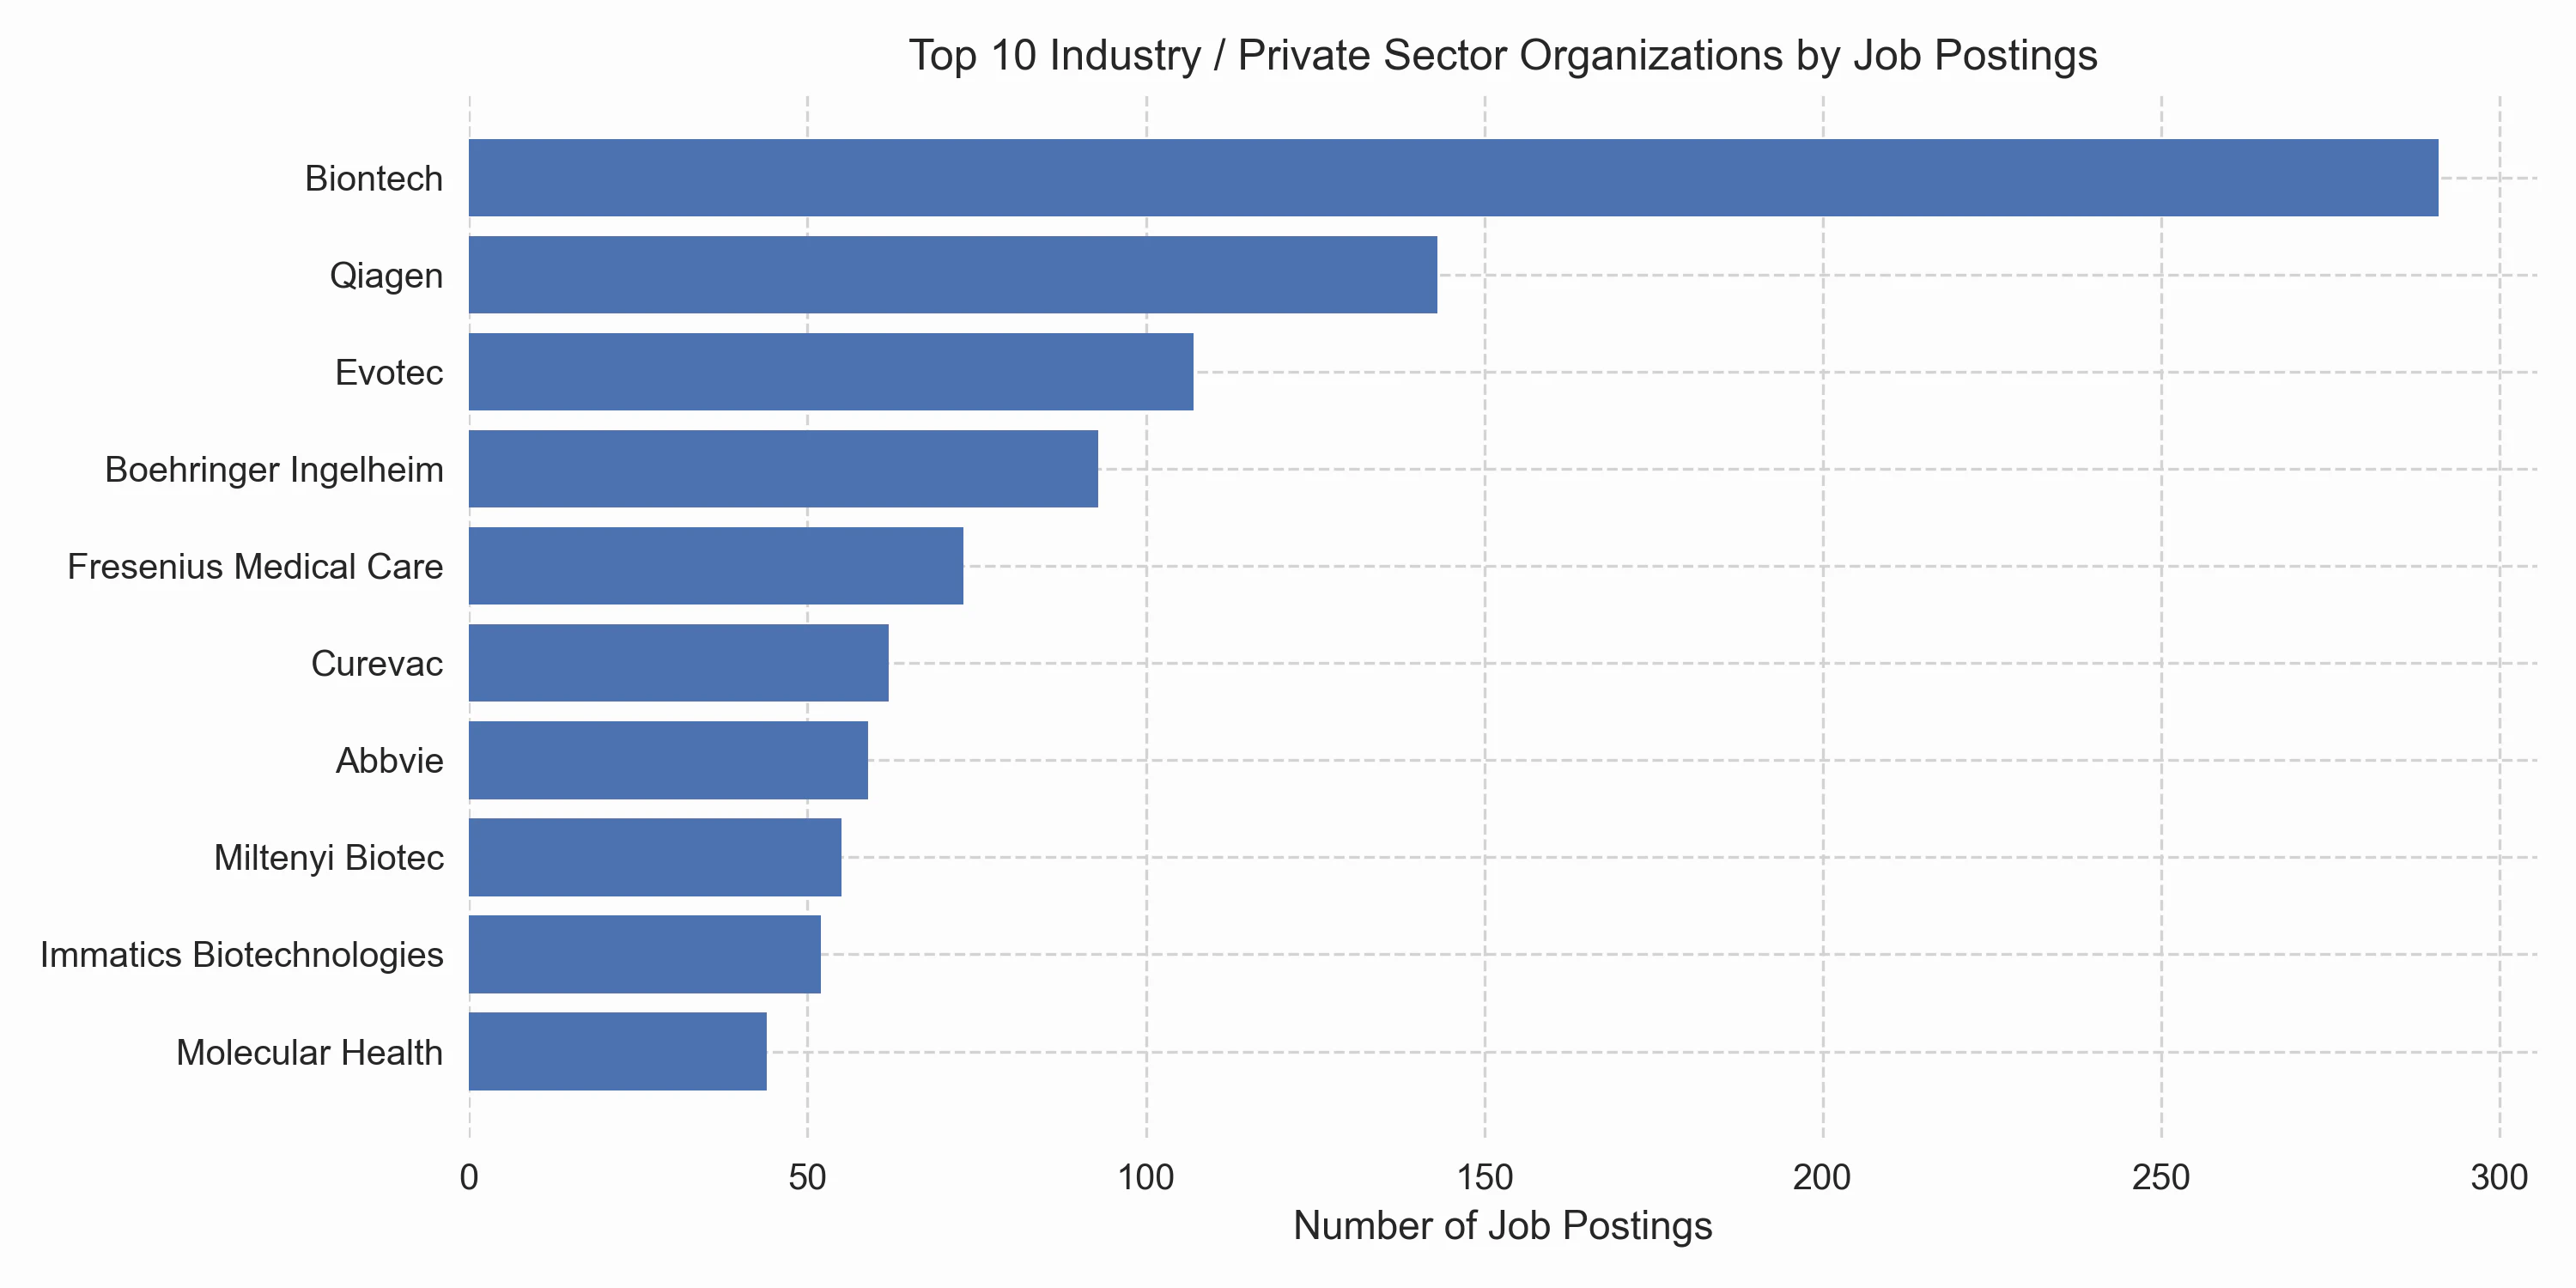
Finally, let’s take a look at the top 10 organizations offering bioinformatics jobs across both academia and industry. Many of the organizations listed here were mentioned earlier. It appears that BioNTech is the largest bioinformatics employer by a wide margin. However, beyond the general caveats of analyzing postings from a single job board, I would like to highlight another reason why this may not accurately represent the total number of bioinformaticians employed: BioNTech is a relatively new company that has undergone exceptional hiring over the past 10 years. In contrast, companies like Qiagen and Boehringer Ingelheim have existed for much longer and already employed many bioinformaticians before 2013.
Job titles and roles
Yet another interesting question relates to the provided job titles: can we infer some interesting career-level or functional categories from them? Several factors make this analysis difficult: there is a big diversity among the job titles; almost no two titles are identical. Furthermore, some positions don’t reveal the seniority level or the precise functions. Because of the large number, any manual curation is out of the question.
So I went with a heuristic approach. First, I defined some categories that I thought made sense based on the job titles that I saw. Here is what I came up with, along with some example titles (only English variants shown):
| Category | Example Titles / Keywords |
|---|---|
| PhD Position | PhD student, Doctoral researcher, Doktorand, Graduate student |
| Research Scientist / Postdoc | Research associate, Scientist, Computational biologist, Postdoctoral researcher |
| Data Science / ML | Data scientist, AI researcher, |
| Software Development / Engineering | Software developer, Bioinformatics engineer, Pipeline developer, Data engineer |
| Group Leader / PI | Principal investigator, (Junior) group leader, Professor, Group head |
| Technician / Lab Assistant | Lab technician, TA, Technische Assistenz, Research technician |
| IT / Infrastructure | System administrator, Cloud engineer, DevOps, IT support |
| Project / Product Management | Project manager, Product owner, Program lead |
| Marketing & Sales | Sales manager, Business developer, Marketing specialist |
| Consulting / Application Support | Field application scientist, Customer success manager, Consultant |
| Regulatory Affairs / QA | QA manager, Regulatory affairs specialist, Clinical trial coordinator |
| Administration | Administrative assistant, Office manager, Coordinator |
| Internship / Student Assistant | Intern, Student research assistant, Praktikant |
| Other | Non-specific titles or unable to assign |
Again, I tasked GPT-5 with the classification task, and it decided to come up with a script that matched titles to categories using these and some other keywords it found in the provided table. I manually corrected some of the keywords. I pointed out that a job title could have multiple matches, and so we changed the script to actually use priority matching based on an ordering that I defined. Essentially, this is based on how I perceived the specificity of the keywords. For example, if “PhD student” occurs, it will be “PhD Position” even if the keywords “software” or “computational biologist” occur. The important distinctions between Research Scientist / Postdoc, Data Science / ML, and Software Development / Engineering are thus at the lowest priority (in that order).
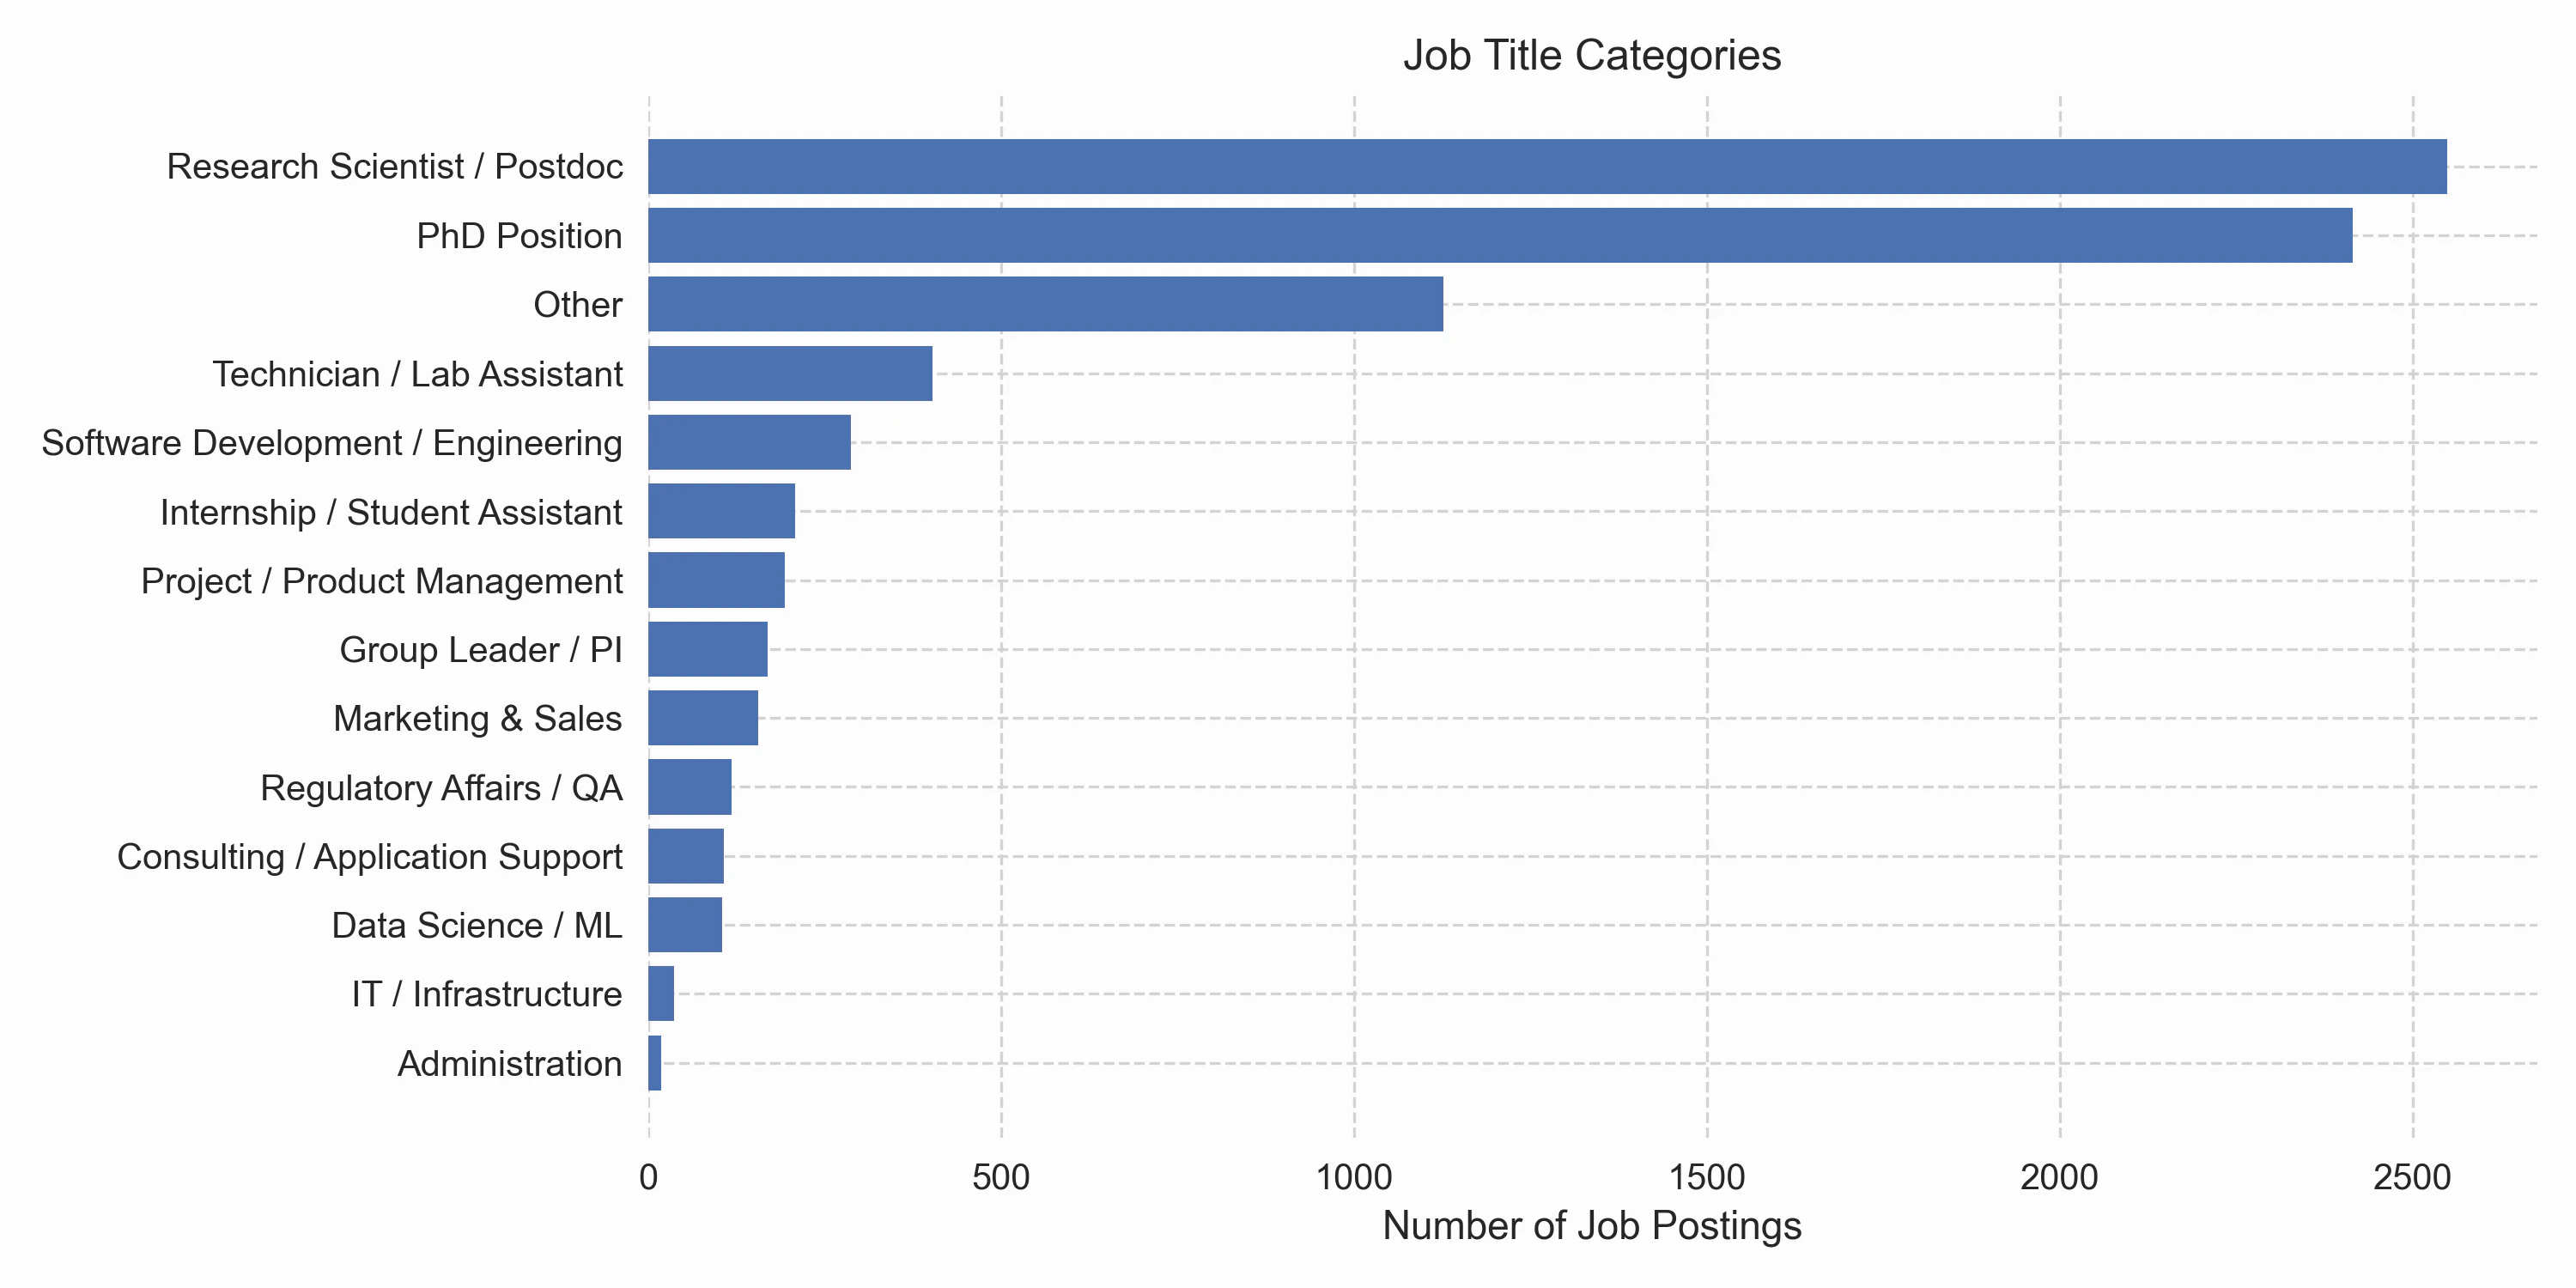
We see that the research scientist, which includes both industry and academic positions, comes out on top. There is a large fraction of “Other,” which is a big bucket of cases where the simple keyword matching has failed. Based on a brief manual inspection of the “Other” category, I think these jobs follow a similar frequency distribution as the remaining categories. However, one can see that there is also demand for bioinformaticians in other roles, such as marketing, regulatory affairs, field application support, and management. I was surprised to see so many lab assistants on the list. But indeed there are some universities offering programs with a larger focus on wet-lab techniques than I had, for example, “Bioinformatics and Genome Research” at Bielefeld University. …
Conclusion
I think the analysis above actually contains some interesting findings that can be helpful for any seeker of bioinformatics jobs in Germany. I am very aware that some of the methods used do not lead to data with perfect precision. However, I did a couple of manual verifications, and in these cases, the numbers were just a few percentage points off. So I think the overall picture would remain the same if this analysis were to be conducted with scientific scrutiny. Please let me know if there are any questions that I failed to answer in this analysis!